Intelligence that follows momentum
Follow
momentum.Find relative
strength.
Inertia scores every US stock on momentum, ranks it against the market every trading day, and can trade your own rules in your own broker account.
Today
Example dataEvery stock gets a score.
Momentum over one, three, six and twelve months, rolled into a single number you can compare.
Then it's ranked against the market.
Relative strength shows which stocks are beating the index, and whether the gap is widening.
Beating the market, and the gap is widening.
See who's leading today.
Open the app to a list already sorted by strength, with the sector beside every name.
Leaders
Example data, not real companiesWatch sectors rotate in and out.
See where strength is building and where it's fading before it shows up in the headlines.
Your rules. Your call.
Build your own rules and backtest them. Then choose: approve every trade yourself, or let Inertia trade automatically in your own US broker account, always inside the limits you set.
Buy Kestrel Power
12 shares, inside the limit you set.
Rules, not hunches.
Every signal comes from clear rules you can test.
Checked every day.
Prices are re-checked every trading day and adjusted for splits and bonuses.
The whole US market.
S&P 500, Nasdaq-100, NYSE and Russell 2000 in one view, built for investors who follow strength.
Also inside
- Momentum ranking
- Sector and theme rotation
- Ready-made scans
- Today's swing list
- Backtests
- Market health
- Results and announcements
- Market note and alerts
- Portfolio and performance
- Trade journal
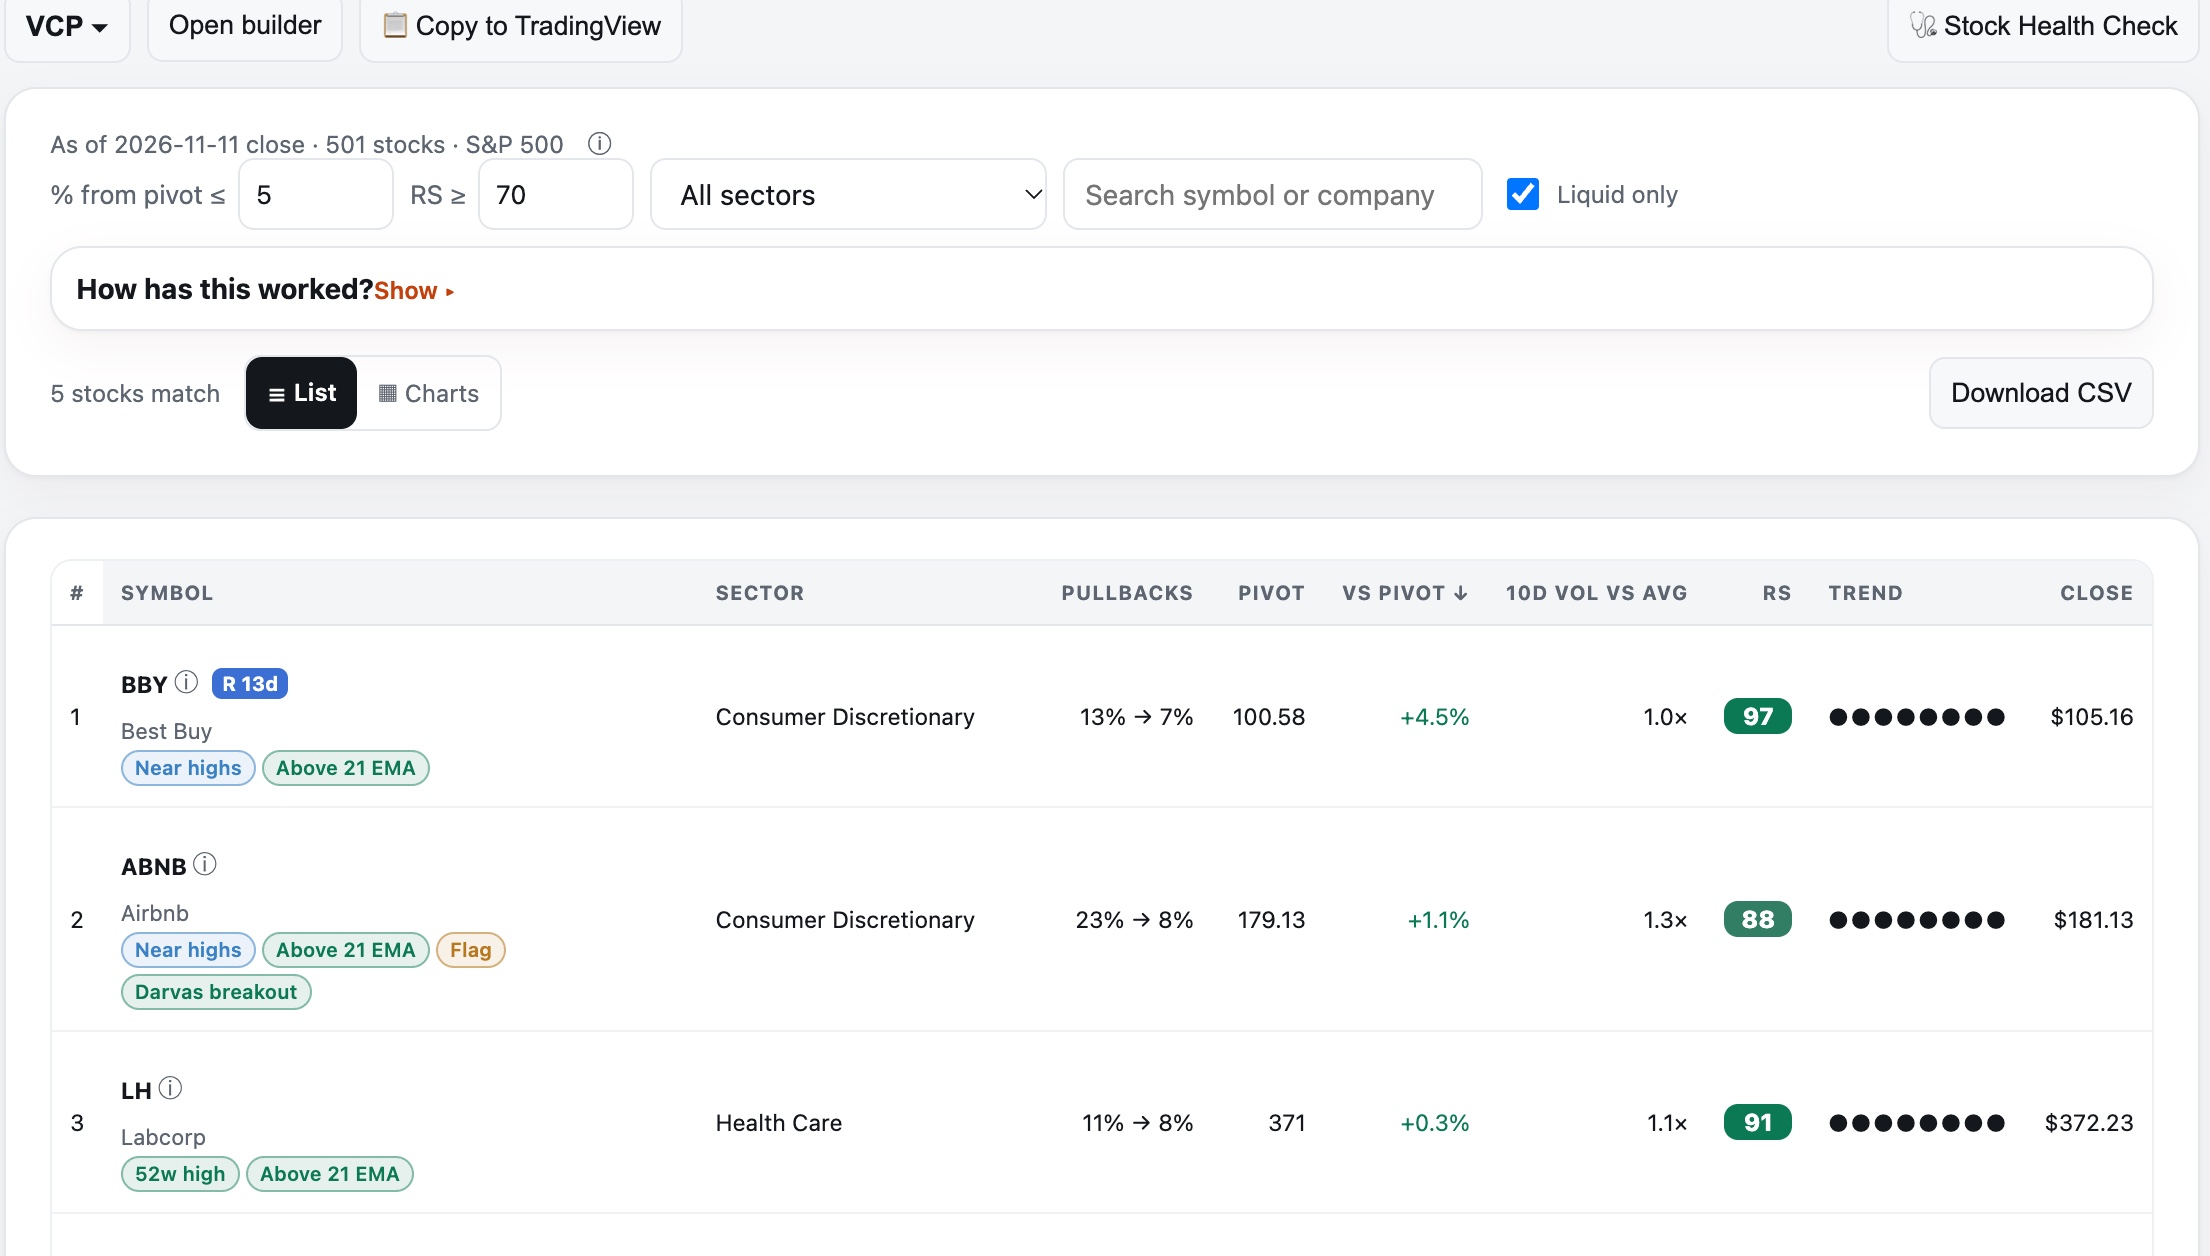
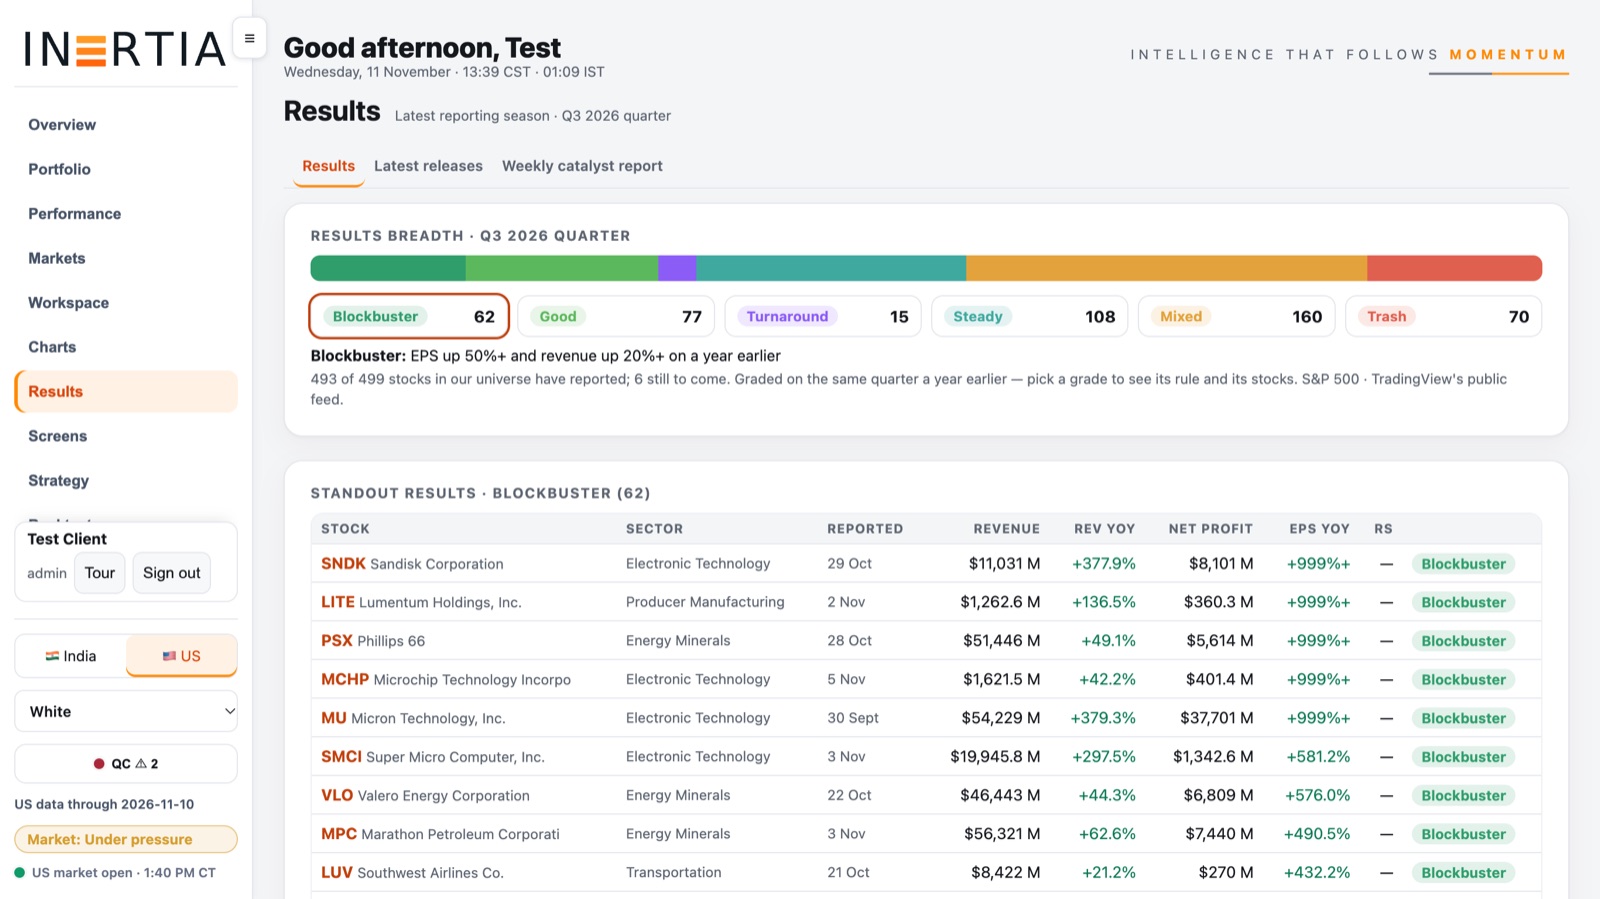
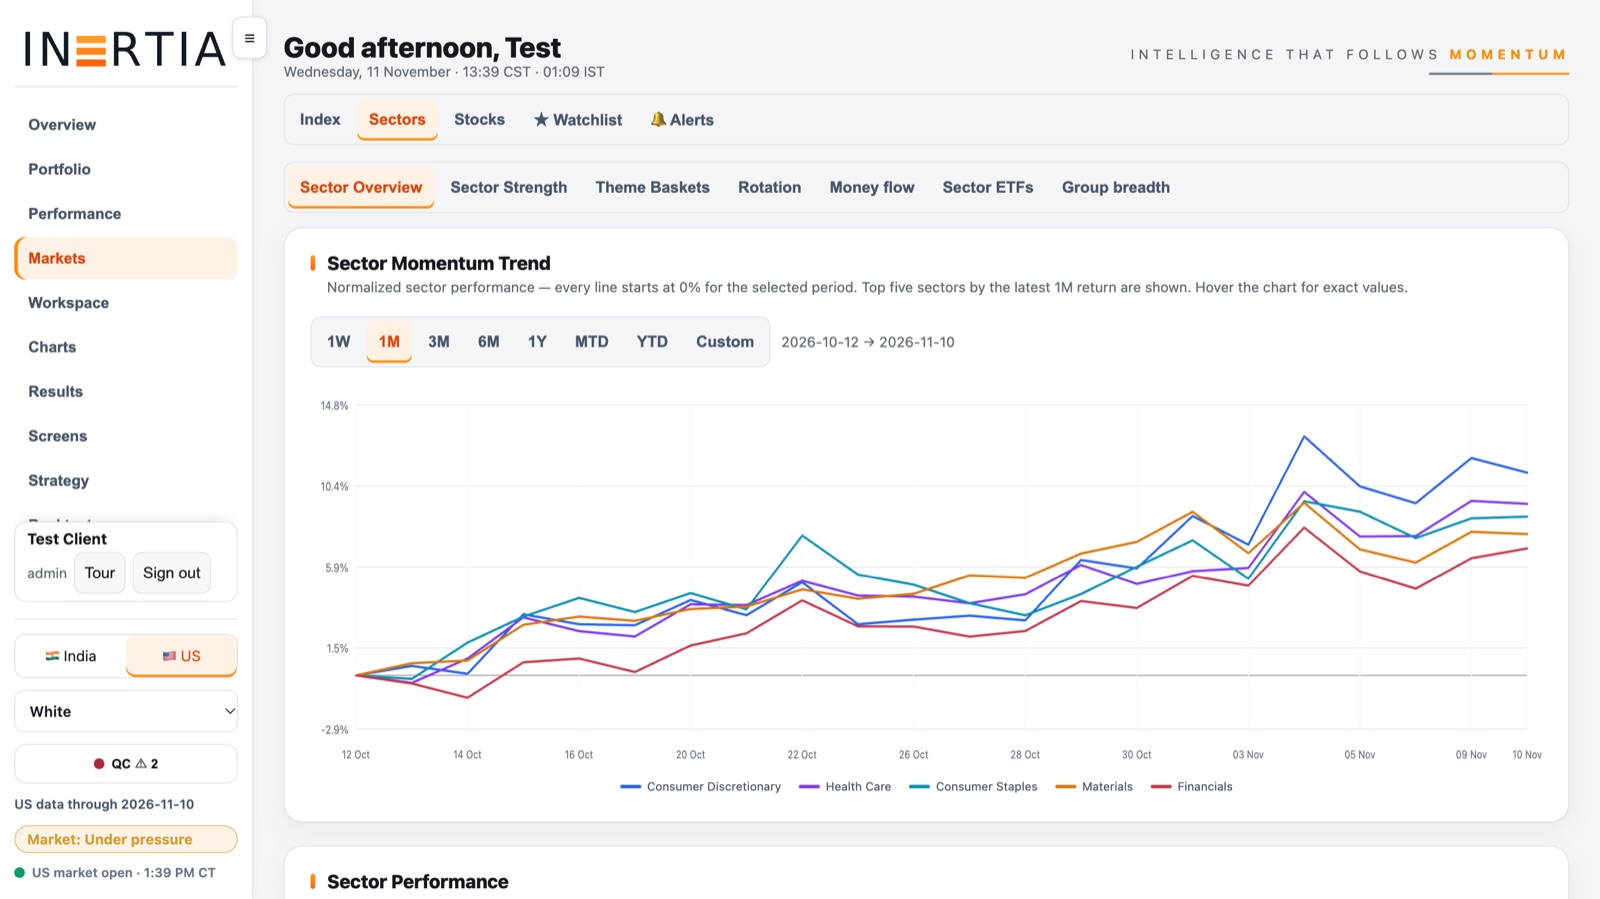
The real thing.
No mock-ups here: these are Inertia's own screens, on real market data.
Start free. Upgrade when you're ready.
US stocks. Your broker, your money, your rules: Inertia never holds your money.
Free
$0
- Market intelligence
- Track your portfolio and performance
- Heatmaps and sectors
- A few sample screens
- 3 backtests a month
Opens 30 November
Research
$15 /mo
- 20 core screens
- Stock Health Check
- Daily rankings, backtests
- Alerts
From 22 January
Pro
$29 /mo
- All 50 screens
- Your own strategies
- Inertia Agentic Trader on your broker
- Approve or automatic
From 22 January
Pro + Inertia
$59 /mo
- Everything in Pro
- Our own maintained strategy
- Smart Agent, coming later
Coming soon
Founding members get 50% off for life.